Car
Aero maps explained: What is an aero map and how does it help motorsport performance?
by Matthew Somerfield
5min read
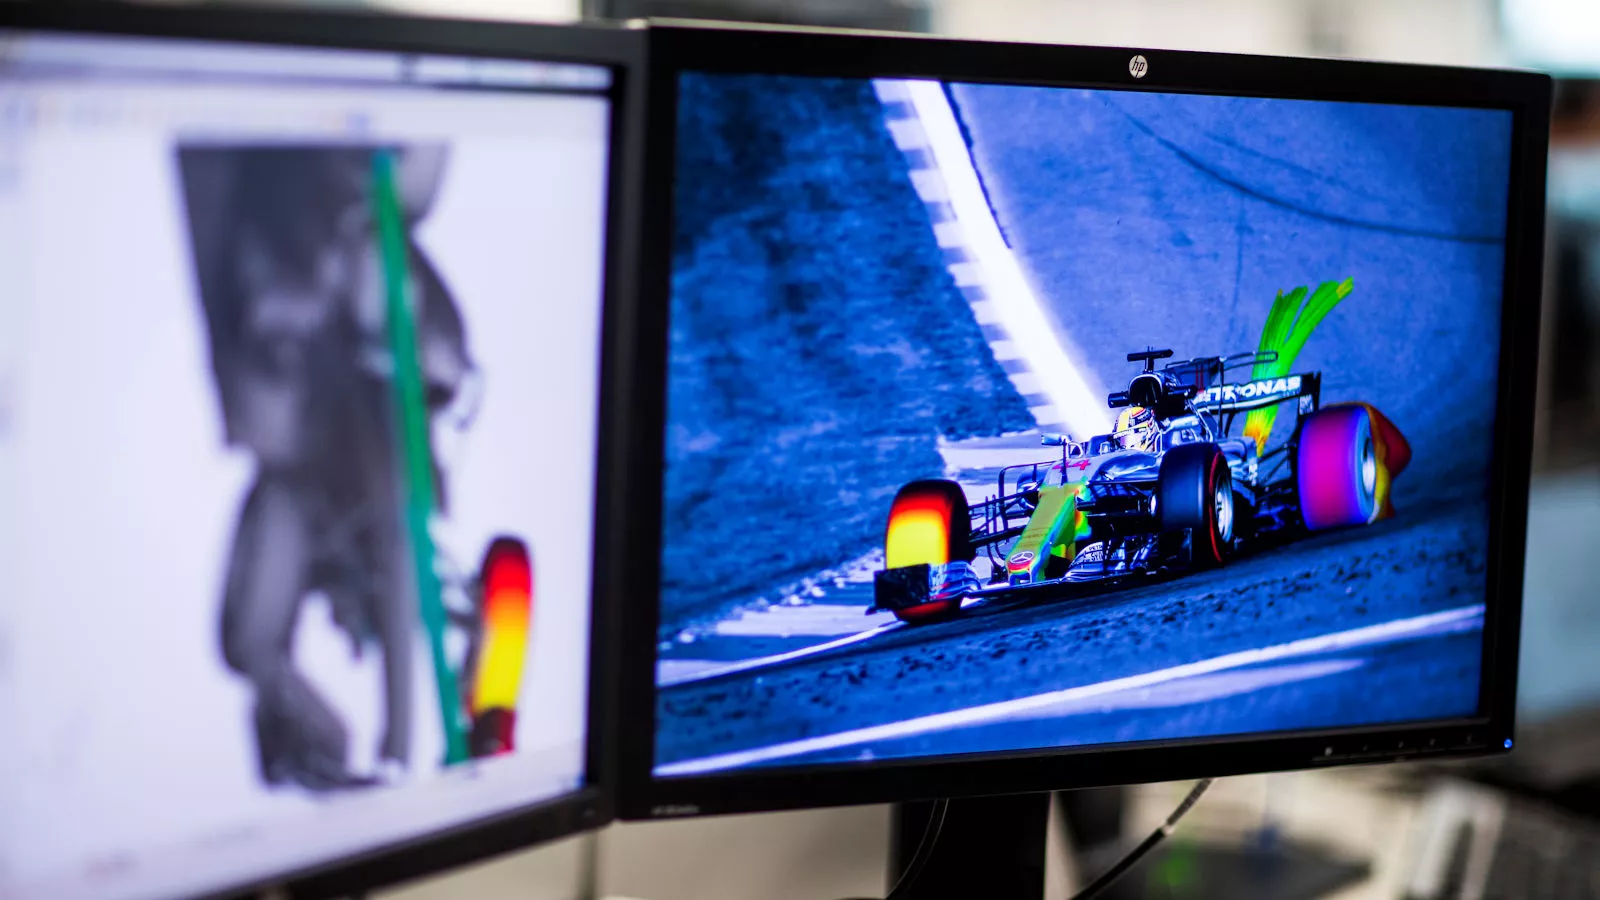
What is an aero map? This motorsport term is often used by motorsport engineers and commentators - but what does it actually mean, and why is it important to teams and drivers in Formula 1 and beyond?
Sign up for a newsletter and we'll make sure you're fully up-to-date in the world of race technology
An aero map offers a visual representation of the aerodynamic properties of the race car but, in a larger sense it’s meant to provide information on those properties over a range of conditions.
CFD (Computational Fluid Dynamics) simulations are initially used to measure and conceptualise how downforce and drag are generated across the car and how they’re balanced front to rear.
However, this can be considered just one page of the map, as other physical influences on the car must be mapped in order to understand how the car will behave over the course of a lap.
The car's real world counterpart will never be in a fixed state, owing to the mechanical properties of the car, the tyres and the track conditions.
Therefore, other factors have to be considered and mapped, including but not limited to the car’s speed, pitch, roll, yaw, steer and ride height, all of which have a non-linear impact on the generation of downforce and drag.
The aero map, explained
The aero map is not just a snapshot. Rather, it can be seen as a dataset created from a combination of tools that’s then visualised as a chart, graph or surface plot for a subset of conditions.
These plots can be thought of as a cheat sheet in many ways, as they offer an overview of where the car’s aerodynamics will perform best over a range of conditions.
They're used by the team in numerous ways, which includes making setup changes to extract performance from the current version of the car, whilst also being used as a metric to help develop new components.
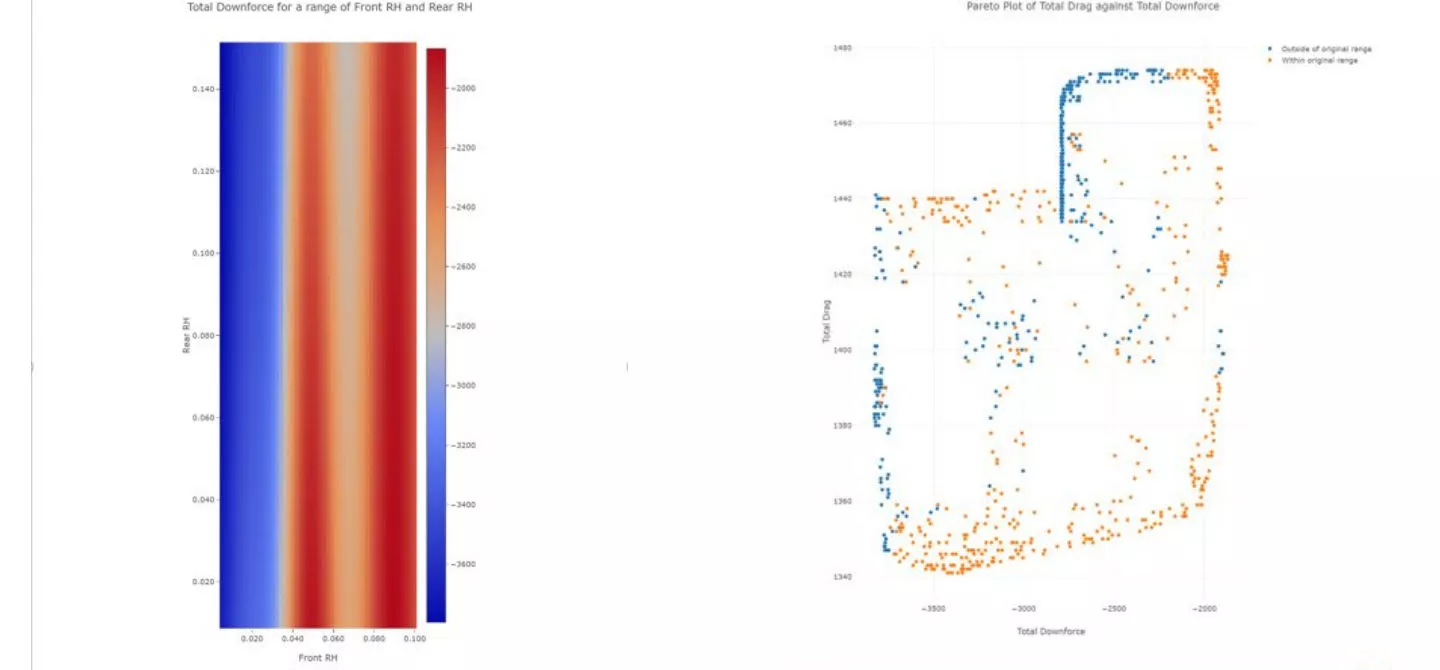
An example of some plots created by Bramble CFD to visualise different data, such as total downforce for a given front and rear ride height (left) or total drag against downforce on the (right) on what is called a Pareto plot
The plots visualise how performance varies with different parameters, allowing teams to understand where the car’s outer limits lie.
One of the key performance factors that will be looked at in this respect is ride height, given its impact on downforce and drag and the front to rear balance that can be achieved.
The team will be looking for a setup that stays more predictable through a lap, stint and race, rather than simply chasing a peak for one isolated moment or corner.
However, there will always be a trade-off and you’ve undoubtedly heard drivers describe a lack of balance to their engineers over the radio through one or a sequence of corners.
This is due to the setup initially being idealised against the aero map for the given circuit, meaning that whilst the driver might feel they can gain more performance through that corner if the aero balance was shifted, they might lose out elsewhere.
The driver and the engineering team will then evaluate setup options that better suit their feeling within the car, whilst being mindful of the aero map and how that might shift the aerodynamic balance elsewhere.
Constructing an aero map
There are three main
ways in which an aero map is constructed - Computational Fluid
Dynamics (CFD), the wind tunnel and track testing, all of which create
a feedback loop that requires constant correlation.
The car, which is first designed in the virtual world, will simulate a range of conditions, such as yaw, roll, pitch and various ride heights, which creates the initial aero map.
After refinements are made to smooth out any issues that may have arisen in those initial runs, the design is then built and run in the wind tunnel. This is usually done at scale to both reduce costs and fulfill any regulatory obligations but ensures the model performs as anticipated when the relevant forces are imparted on it.
After some back and forth ensuring that the design performs well in both the virtual and scale environments the car is built and real-world track testing is conducted, where additional data is collected to further refine the aero map.
Often seen as a one-way pipeline, from idea, to digital creation, scale model and then new physical component, it would be better to perceive it as a set of feedback loops, whereby development is redirected between the various loops to address any development or correlation issues that arise.
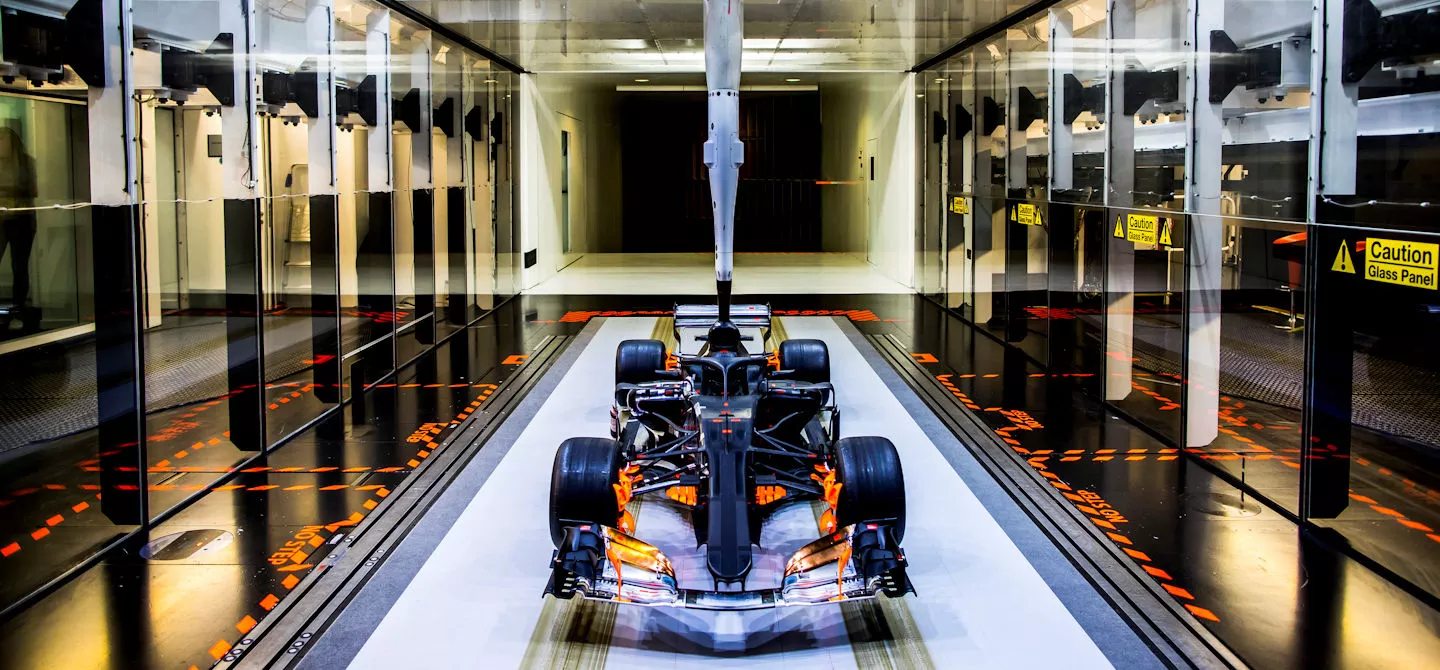
Mercedes’s W09 F1 model in the wind tunnel at Brackley
The quality of the aero map comes down to the fidelity of the resources that are part of the feedback loop and this is why you’ll often hear the word correlation used within the same conversation.
Any contrary information collected in the real world has to be understood and corrected in the virtual test environments, with various methods used on the real-world car to collect additional data to aid in this correlation.
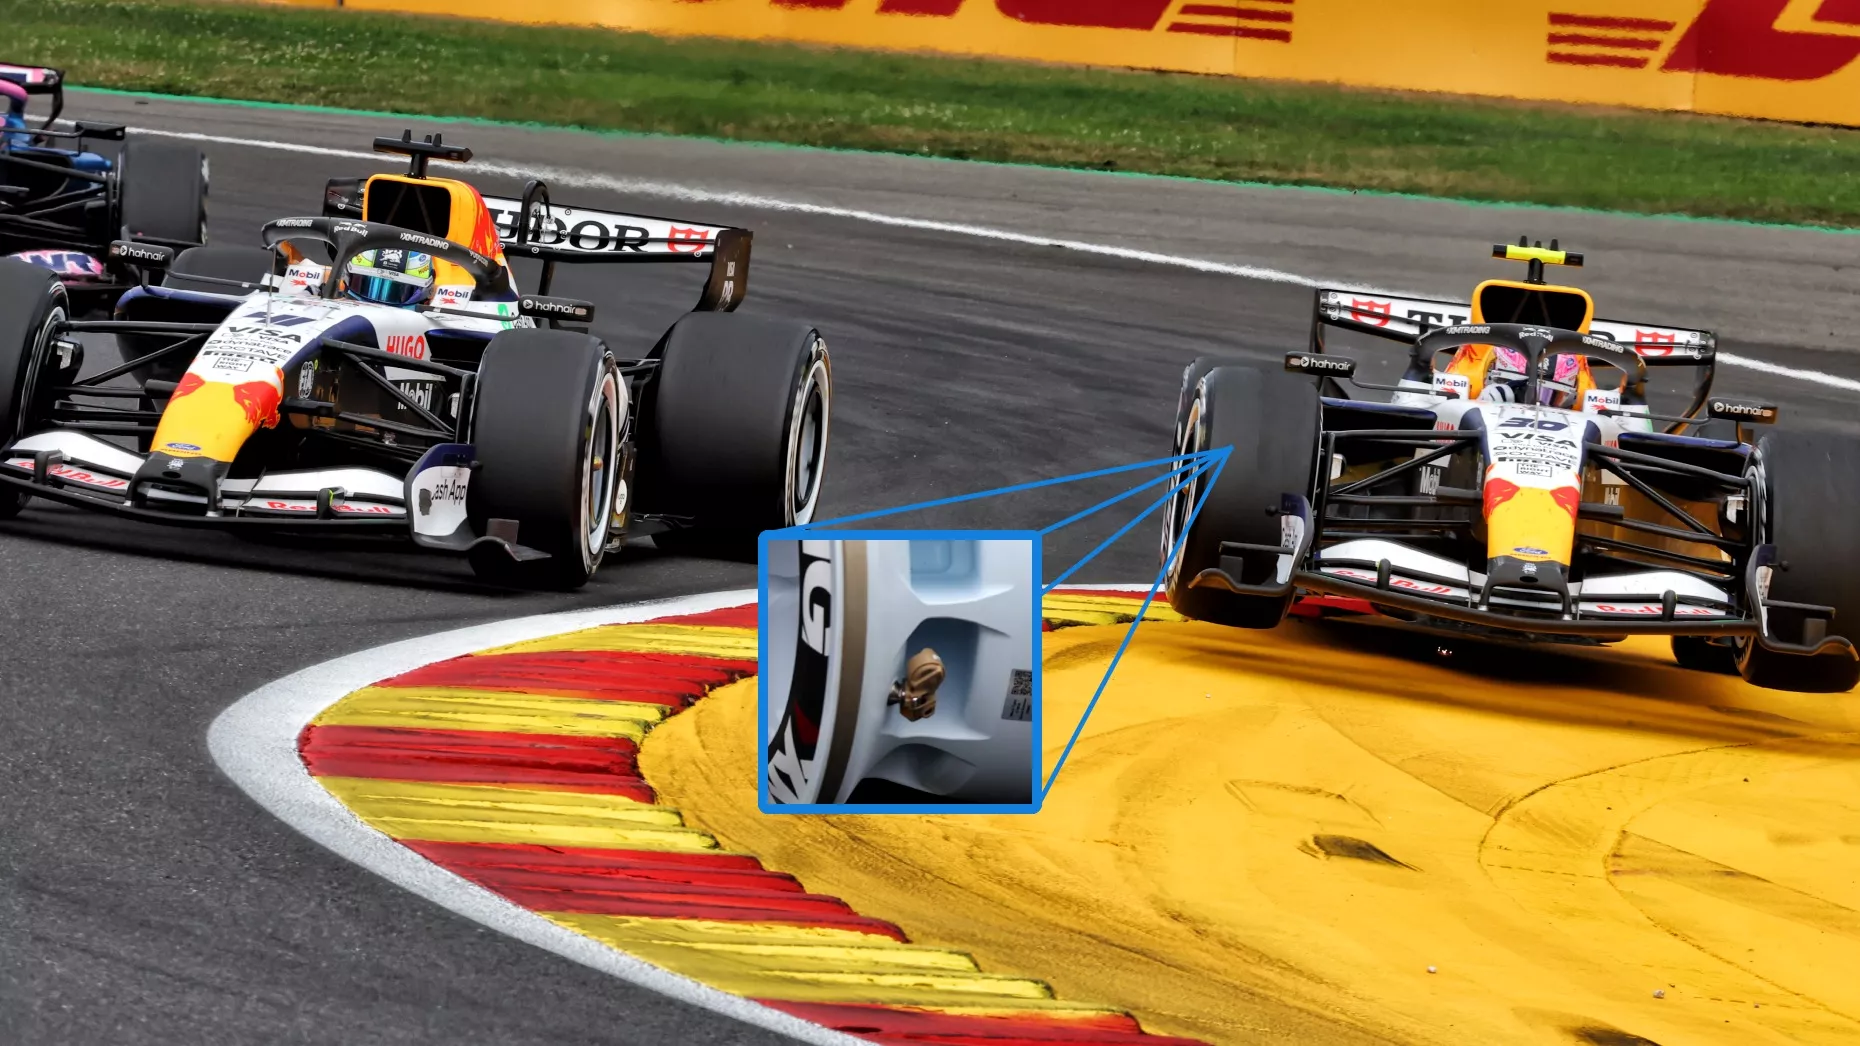
This includes mounting Kiel probe rakes (or aero rakes) on the car, using flow-visualisation (or flow-vis) paint, installing more pressure taps than would ordinarily be on the car and gathering information from the onboard laser ride-height sensors.
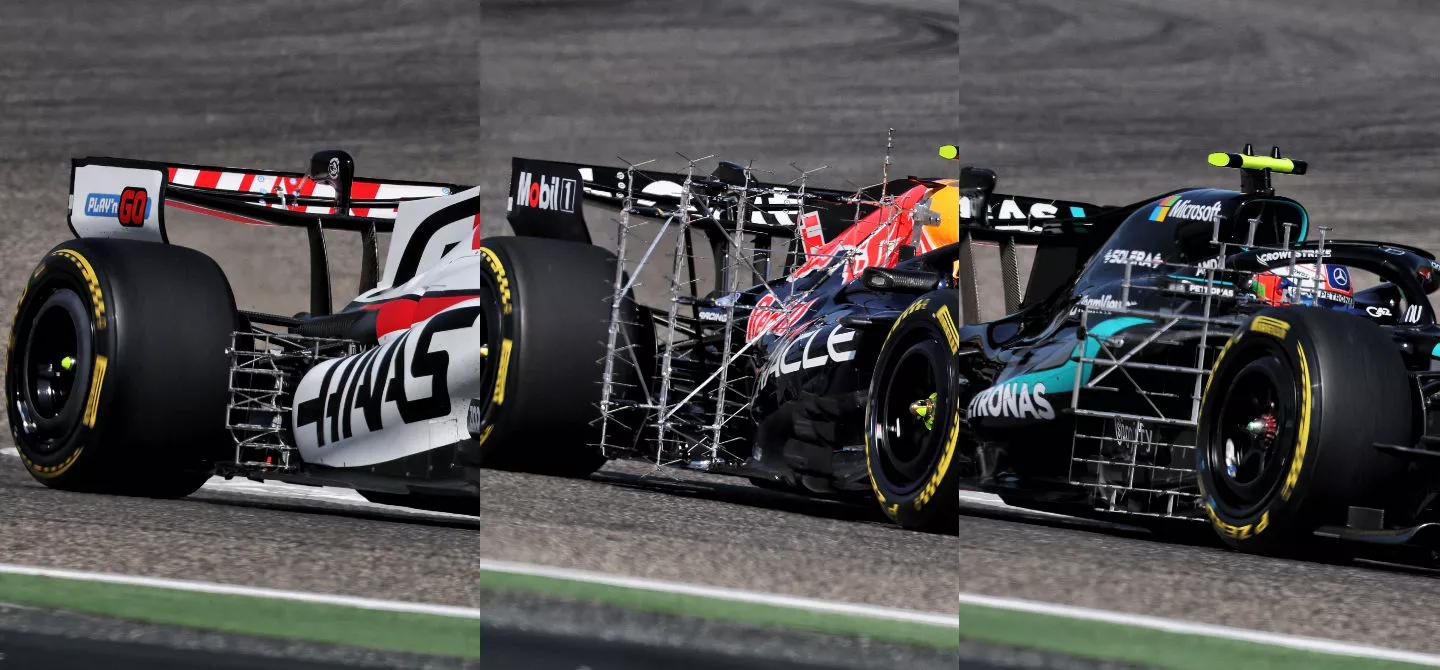
Haas, Red Bull and Mercedes all with different size Kiel probe rakes - also known as aero rakes - mounted on their cars and in different positions during pre-season testing
Kiel probe rakes are commonly installed on F1 cars during pre-season testing, in order to capture more data on the new car and ascertain whether the flowfield in the region it’s been installed is performing as anticipated.
The rakes themselves are often designed with the intent of reducing the impact they might otherwise have on the flowfield, with the framework designed to be as non-invasive as possible.
The data captured by each of the Kiel probes can then be used to build up a picture of the airflow’s behaviour over time and through a range of conditions. However, given their size and weight, they’re really only used for constant speed tests, rather than flat-out running.
And, given the quantity of probes that make up a rake, there’s a huge amount of information being logged, all of which has to be stored on the car and is then offloaded, along with the physical equipment after a designated number of runs.
The installation of new aerodynamic components during the course of the season can also coincide with a Kiel probe array being used during the corresponding free practice session that weekend, as the team both check performance against the previous known quantity and check for correlation against their simulation tools.
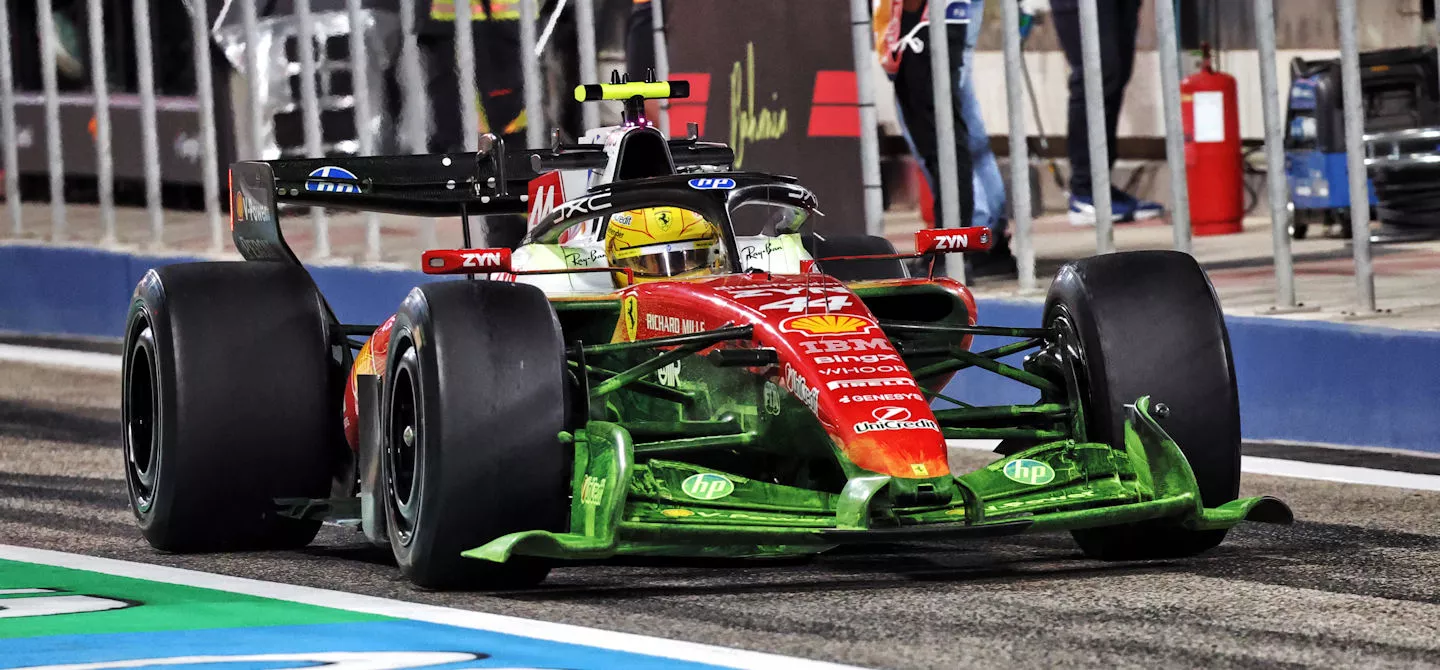
Flow-visualisation (or flow-vis) paint sprayed on the front wing of the SF-26 during pre-season testing
Another, often seen as more rudimentary method for understanding the airflow’s behaviour over a surface is the application of flow-vis paint. An oil-based paint that’s mixed by the team and applied to the surface that they want to study.
By comparison flow-vis offers more of a single state study though, as the paint will dry as it streaks over the surface and preserve that state for when the driver returns to the garage.
It’s here where team members usually take high-quality photos of the surface to be studied back at the factory, with some teams opting to use UV sensitive paints, in order that any spy shots captured by other teams can’t garner any information for themselves.
The images will help the designers to better understand where the flow structures might be breaking down, which in turn can lead to better correlation and an enhanced understanding of the overall aero map.
These methods help to unify the information seen in the virtual and real world environments, allowing the team to make any necessary changes to their processes, equipment or methodologies.
How the aero map helps teams extract performance
This is often why we see teams make numerous updates to the same components on the car, without completely changing the overall concept, as each iteration of a design is not only about delivering performance but ironing out any imperfections that have been caused by non-ideal correlation between their tools.
In a wider context it’s why the aero map is an incredibly important tool, as it can build a much wider picture to help balance the car for more performance over the course of a lap or race.
However, if the car isn’t in the right setup window and the downforce available is split badly across the axles it can result in poor balance and understeer/oversteer at different cornering speeds.
The optimum aerodynamic window will not be the same at each circuit either, so this feedback can help find the most efficient aero window, through mechanical setup changes, such as alterations to the spring rate, damping and ride height.
And, whilst the real world environment clearly offers the most accurate path to improving performance, the data that’s gathered during Free Practice sessions for an F1 team can be crucial in finding any missing ingredients, as the test driver has many more hours available in the simulator to find a more balanced setup.
That overnight session, now with the advantage of having real world data fed into the loop, is often overlooked in terms of how much performance can be found, as the simulator/test driver can quickly run through a list of parameters without the need to make physical setup changes on the real car.
Bridging the gap between models and reality
This knowledge is also used to drive aerodynamic development, as the data provides insight into the relative strengths and weaknesses of the given package.
The designers can then look into facets of the cars design and find ways to stabilise aerodynamic performance against the backdrop of the car’s mechanical properties, rather than just chasing peak downforce in one ideal condition.
In this respect the game really changed in 2009 for F1 teams, as they no longer had the luxury of conducting in-season track testing, whilst the first tranche of restrictions were placed on wind tunnel testing too.
Teams that previously had the resources enjoyed the ability of running multiple windtunnels, often at full scale, whereas the regulations now restricted them to a 60% scale model and no speed exceeding 50m/s.
This led to a rapid escalation in the use of simulation tools, with CFD at the forefront of those endeavors.
The advancements made with this technology has since led to significant limitations being imposed on its usage too, which further highlights how important it’s considered in terms of delivering performance.
The sport also realised that the teams that had made an early investment in these tools and processes would always have somewhat of an advantage over those at the back of the pack, which has resulted in a sliding scale being introduced.
This is tied to championship position, with those at the front of the pack given less time in the windtunnel and less CFD runs than those towards the back, with those limits reset twice yearly.
| Coefficient C as a function of Championship position, P | |||||||||||
|
Championship Classification P |
1 | 2 | 3 | 4 | 5 | 6 | 7 | 8 | 9 |
10+ or new team |
|
|
Value of C % |
70 | 75 | 80 | 85 | 90 | 95 | 100 | 105 | 110 | 115 | |
This means that a team placing seventh in the championship will receive the baseline allotment of 320 wind tunnel runs and 2000 CFD items, whereas everyone else will have their usage scaled accordingly.
An aero map is an essential tool for developing, understanding and improving the performance of the car. The analysis of the aerodynamic forces and their sensitivity to the vehicle's attitude allows teams to make informed decisions on setup and development direction.
CFD offers a cost-effective environment to vet the design of the car but wind tunnel and on-track testing remain invaluable in validating those initial findings, especially when we consider the aerodynamic platform’s sensitivity to pitch, roll, heave, yaw and ride height.
Understanding these provides critical information on how to achieve the optimal setup, be it mechanical or aerodynamic across different track conditions.
Teams will therefore continue to invest in the processes, methodologies and technology that bridges that gap between their theoretical models and real-world behaviour.
/xpb_1418541_hires-(1).webp?cx=0.5&cy=0.5)